Each morning I wake up thinking, “did the server make it through the night?” From it’s first sparks of life, a couple things have been high on my todo list: backups and monitoring. As someone learning Docker for the first time (and re-learning Linux since high school), I have already gone through a gamut of monitoring tools. Here, I’ll share my journey and where I have landed.
Container Control
First, I think – are my containers running? The Docker app provides a built in, very simplistic way to see container names, uptime, and the ports they are using: docker ps
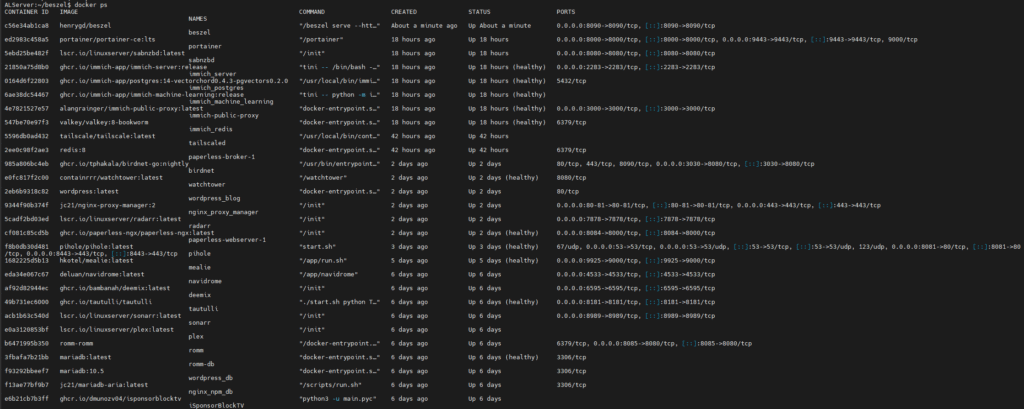
I still use this command to see the hash of my Container IDs and a quick glance for service names, but I realized I wanted to know more. How much memory are the containers using? What about CPU usage? This is when I found ctop.
apk add ctop
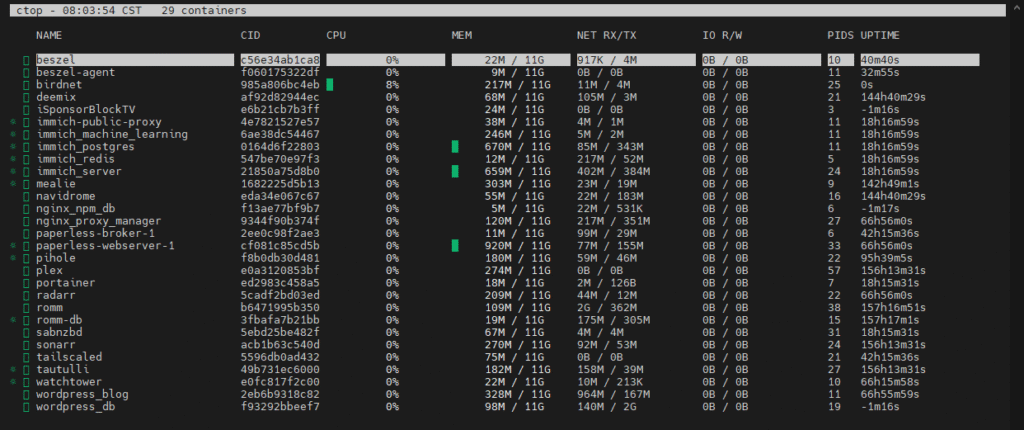
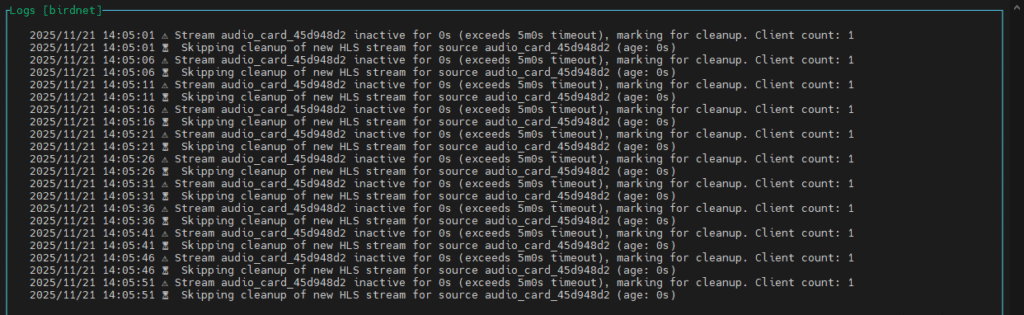
I love this command! Now I can see usage – and it updates in real time! Additionally, ctop allows you to navigate left and right to see more specific information about the container, like logs:
It’s at this moment I realized I was thinking too narrow. All of this information is about the containers on the server, but what about the server itself? What about the other devices on my network? How can I monitor everything? What if I’m not home at a terminal?
Uptime Kuma
Next came Uptime Kuma. This was a neat docker container that allowed for configuring monitors to ping IPs or ports on the network for uptime validation. Each Docker service is running on its own internal TCP port, so the uptime monitoring looked and felt great, and this monitoring was now accessible from outside the terminal in a browser.
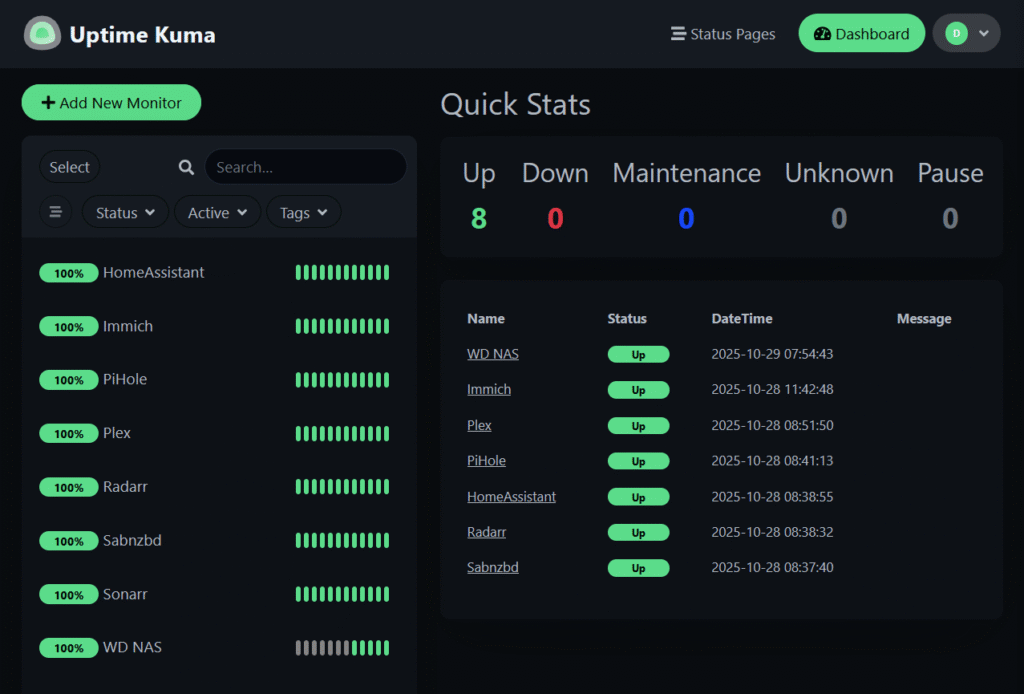
Unfortunately, while this does give me a look outside the containers and into the network as a whole, I would have to use two apps to see all the information I want for inside the containers as well.
Grafana & Prometheus
Someone reading this running this stack is going to cringe when I say I these are just too complicated for both me and my environment. Grafana is a visualization dashboard that integrates a lot of enterprise business features like ticket/incident management and test environments; Prometheus is the metrics and monitoring service that feeds the data to Grafana. While trying to configure this for all my services and create a functioning dashboard from scratch, the headache became too much to bear and I moved on.
The Bestzel of Both Worlds
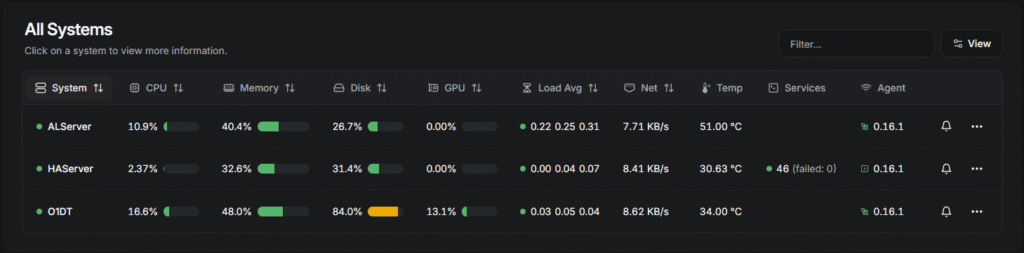
Finally I have fallen on the tool that fits all of my needs: Beszel. This dockerized container runs an agent on each node and the agent on The Lab node automatically catalogued the docker services. I found a HomeAssistant addon that installs an agent on the HAOS for monitoring it as well.
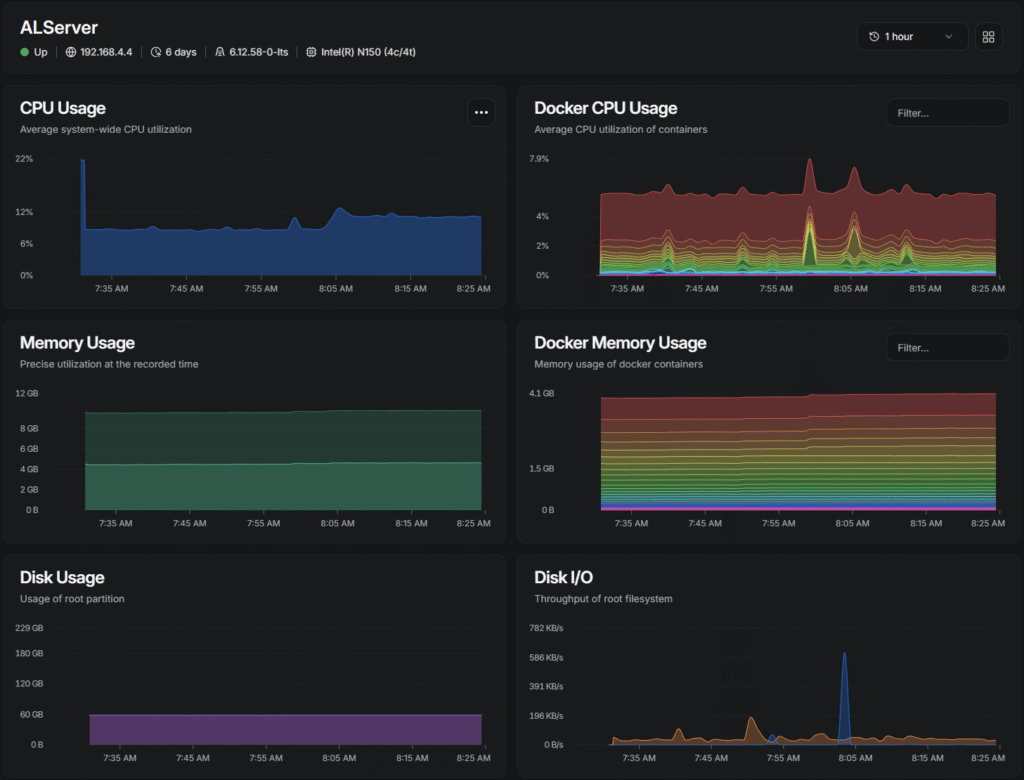
Clicking a device expands usage metrics, including Docker CPU and memory graphs
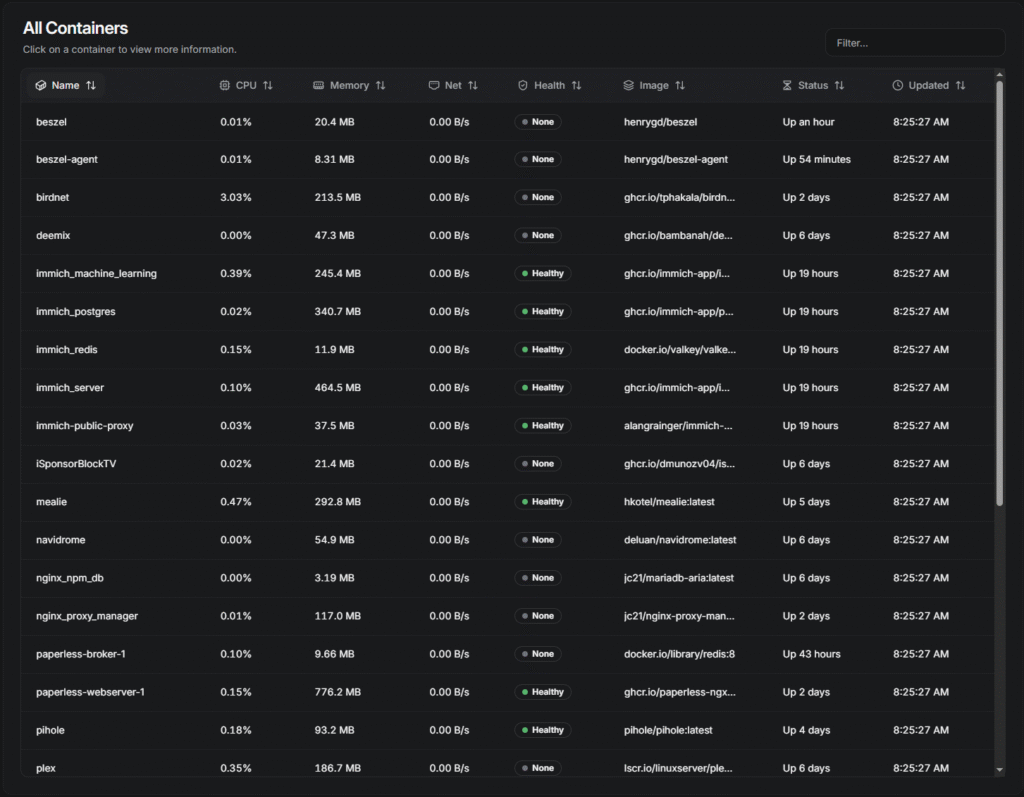
Beneath the graphs I’m able to see an itemized list of containers much like what what available in ctop
After a couple weeks of running Beszel, I have decided to keep it as my monitoring solution of choice.
The final piece of my puzzle was to set up notifications.
Hook ’em
The most seamless notification system that has support across most of the self-hosted apps I am interested in, are Webhooks. I created a private Discord server which allows me to generate a Webhook for each service:
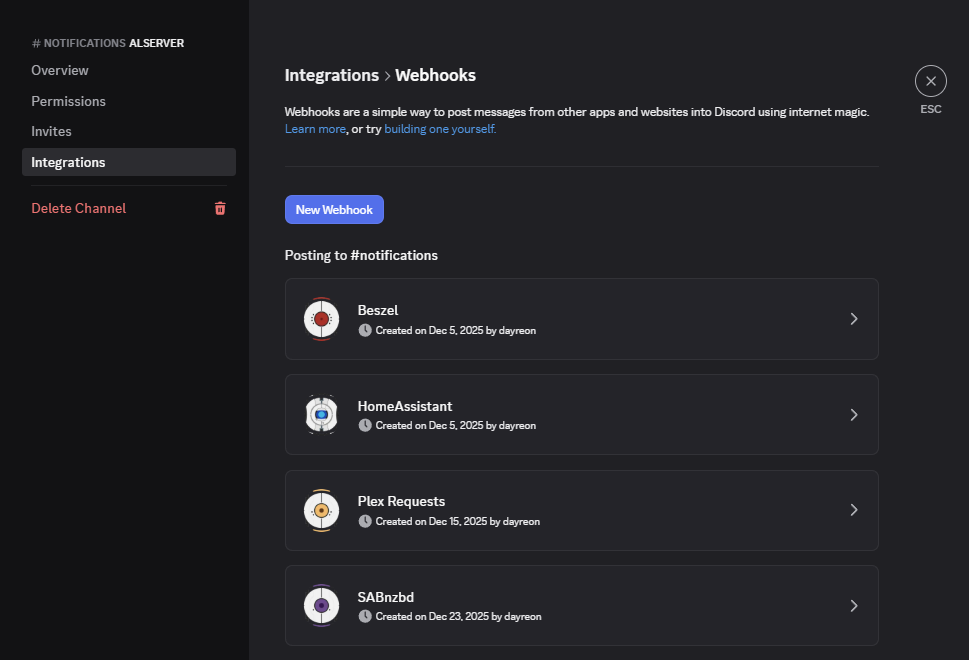
Then Beszel allows configuration of triggers to that Webhook when certain server variables hit their thresholds:
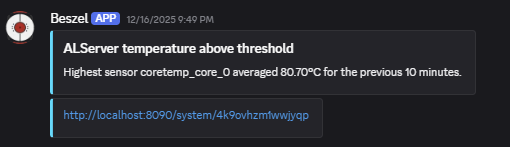
This solution has opened up a lot of doors in terms of centralizing notifications from all of my services without relying on the server to be up!